


Beyond The Productivity-Pay Gap
How Does Methodology and Theoretical Frameworks Influence Our Models?

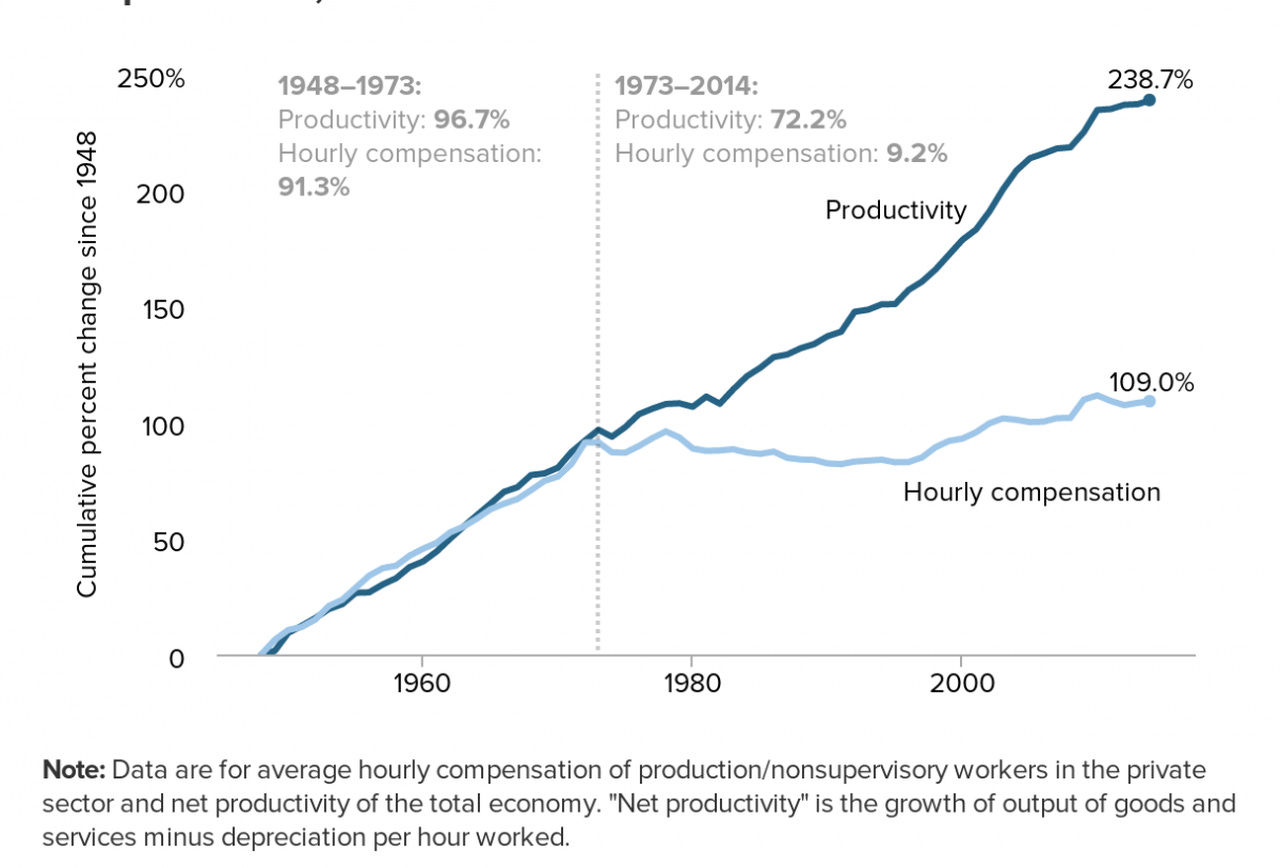
The "productivity-pay" graph has become one of the most frequently cited graphs in popular discourse over the past decade. It caused lots of discourse among policymakers, economists, and public intellectuals, particularly in the United States, due to claims that wages have increasingly diverged from productivity growth. These assertions primarily stem from an Economic Policy Institute (EPI) report. In this report, the EPI compared payroll survey wage data with productivity growth calculated from net output metrics, covering the period from 1948 onward. The main conclusion of their analysis was that wage and productivity growth were closely aligned until the 1970s, after which wages began to stagnate despite continued increases in productivity:1
Although variations of this graph have been disseminated over the years, the version produced by the EPI has become the most recognized and frequently cited. So I will focus specifically on their report.
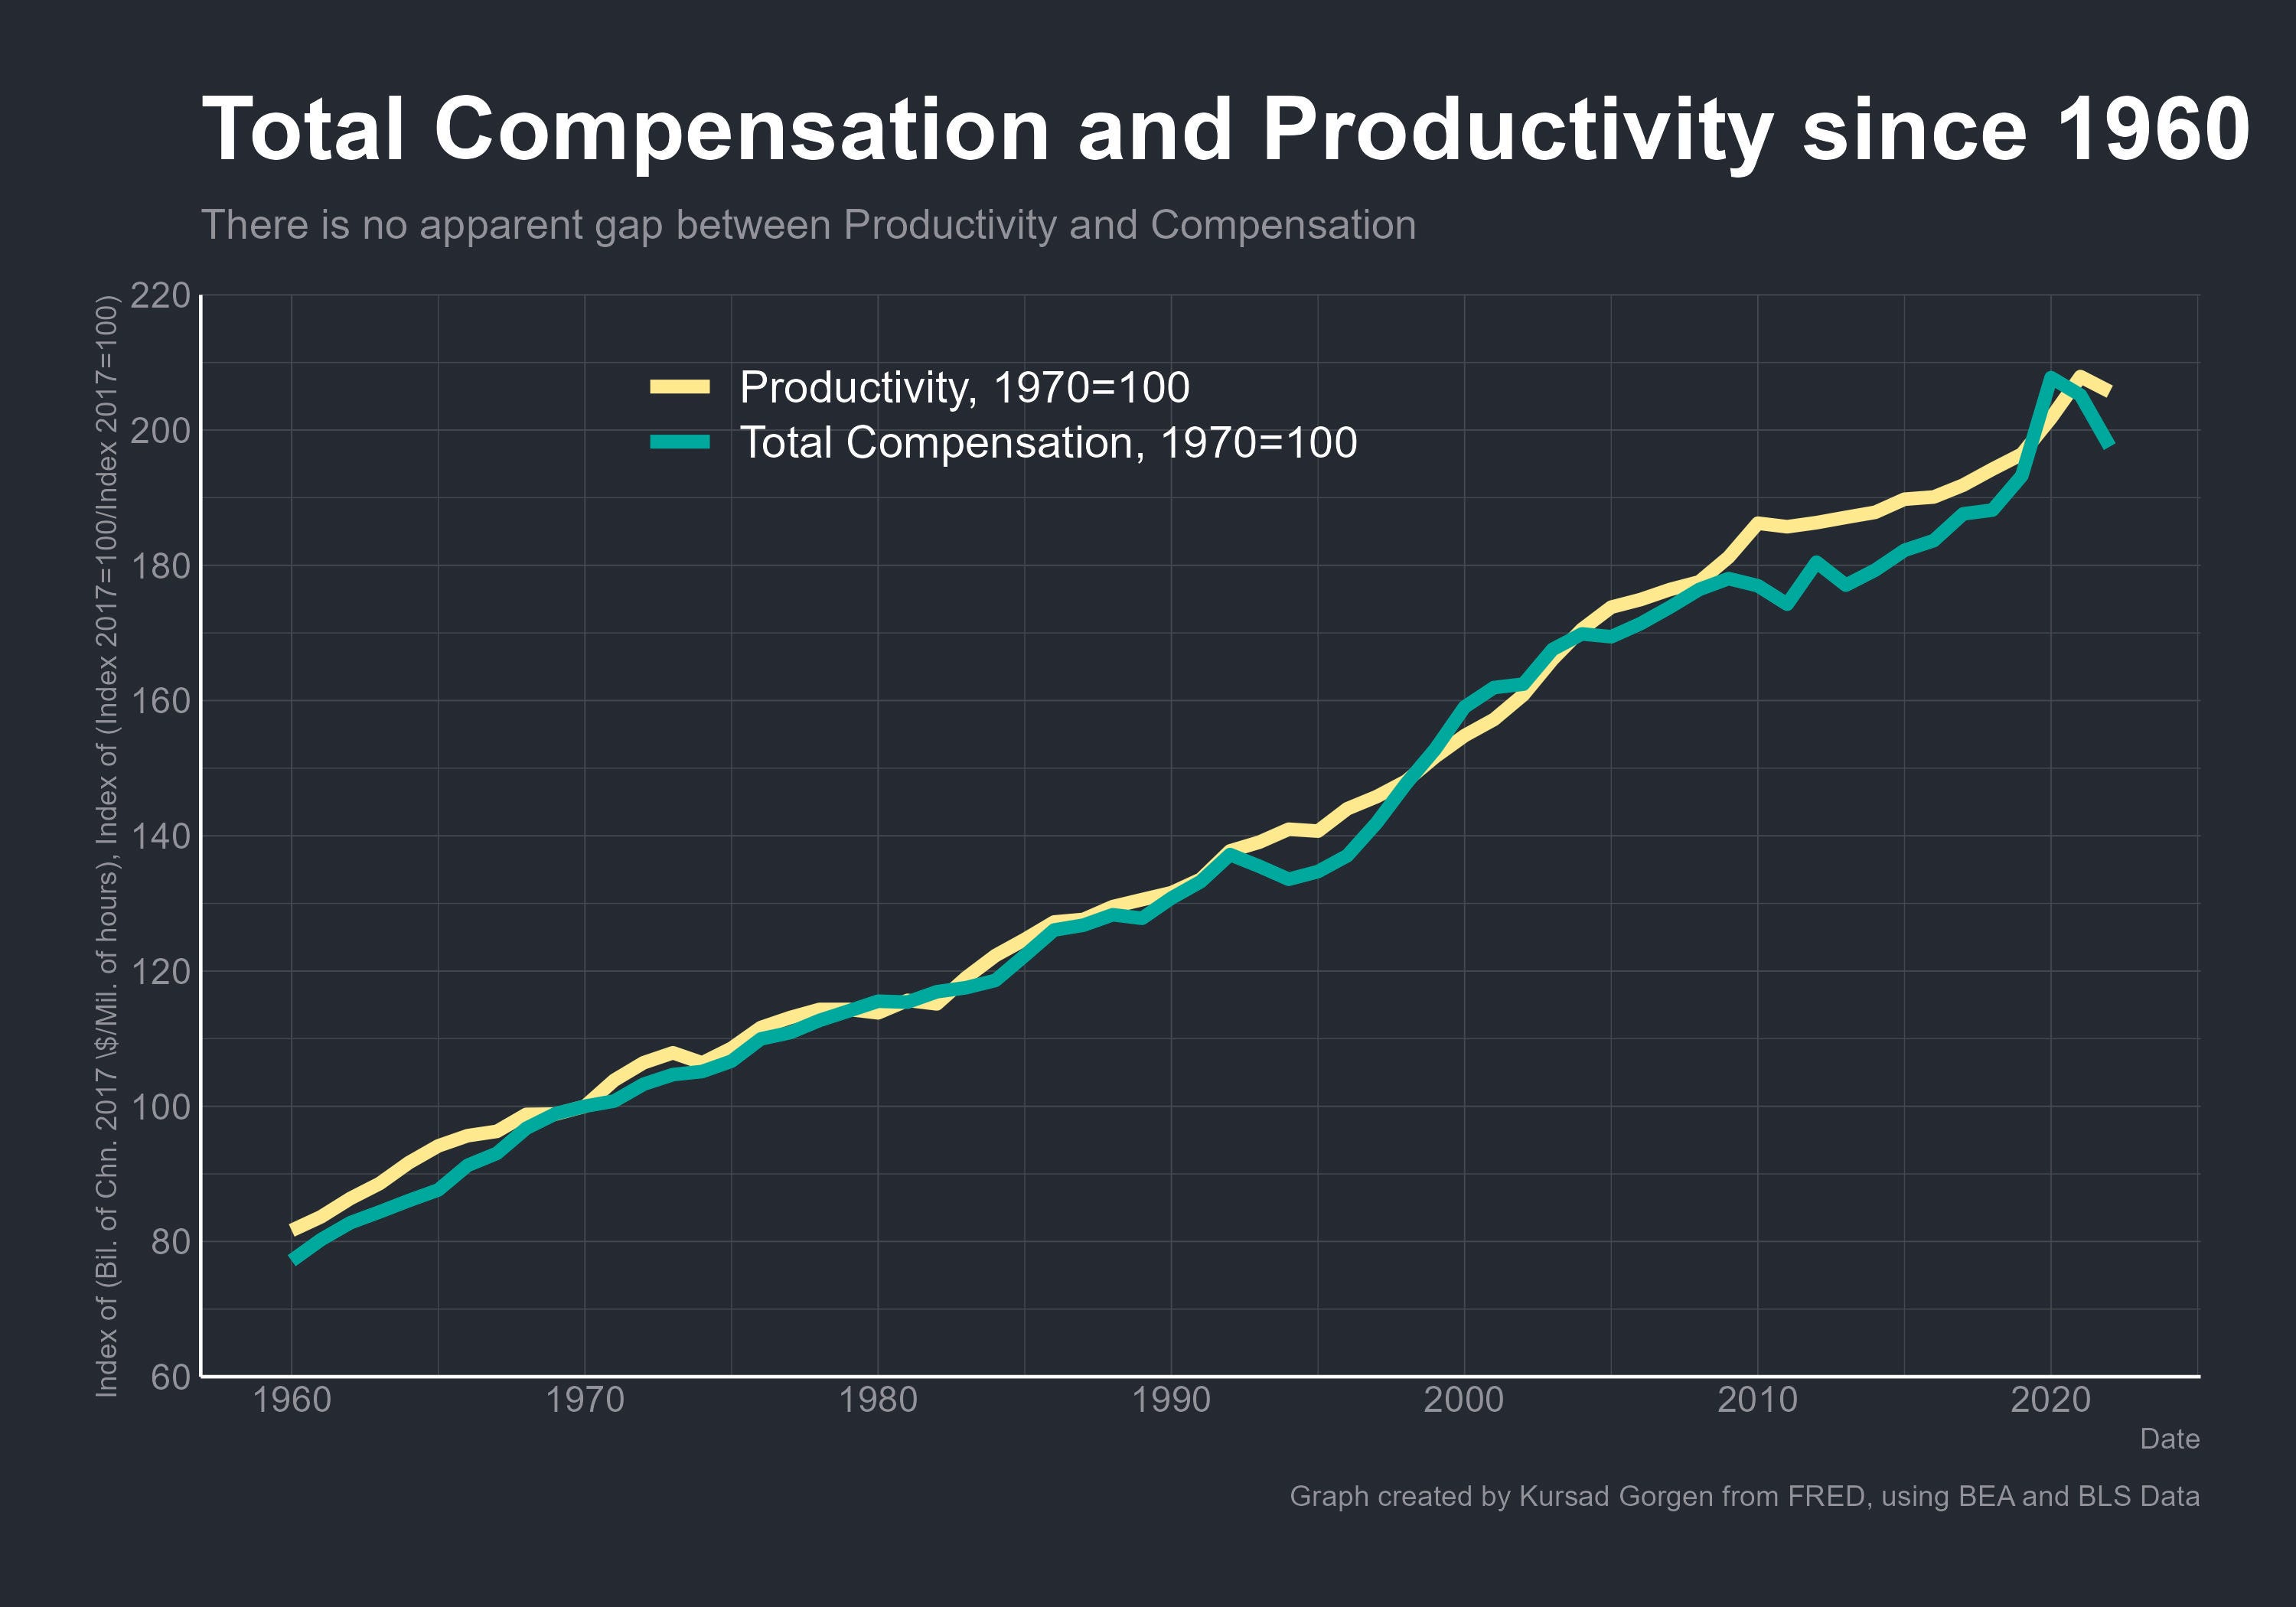
Economists have shown over the past decade that this analysis is based on a flawed methodology. Martin Feldstein demonstrated that the apparent discrepancy stems from comparing incorrect data.2 When we use the full data, wage and productivity trends closely track each other. Similarly, the St. Louis Federal Reserve published a study that draws the same conclusion.3 Dean Baker from the Center for Economic and Policy Research found that if we compare the same groups of workers and use consistent inflation measures, wage growth mirrors productivity growth.4 Robert Lawrence reached the same result.5 Stephen Rose also showed that there is no gap between wages and productivity.6 Later, Scott Winship from the American Enterprise Institute published a comprehensive report on it.7 Yet, the graph hasn’t lost its impact —how could it, especially when so many politicians keep repeating this long-debunked claim?
In this post, I will mostly follow(and repeat) the previous works and research about the “productivity-pay" gap.” Even though many economists have already conducted extensive research on it, I believe it would still be worth revisiting. Revisiting a topic, no matter how often it’s been discussed, not only refreshes our memory but also helps us think more systematically and evaluate our reasoning process. On top of all this, as the old saying goes, “a change of work is the best rest.” Currently, I’m working on two projects—one comparing the economies of Turkey and Vietnam, and the other analyzing NGDP targeting through its integration into a DSGE model. Shifting my focus to a different topic allows me to rest.
Additionally, since I’ve started seeing this graph circulate more widely in Turkey, I decided it was necessary to provide an analysis of the methodology behind it. I wanted to discuss how methodology is applied in economic research what we need to pay attention to, and why all of this matters.
To have this conversation, we first need to address the basics: how we measure these things and the fundamental principles underlying our approach. I believe this will be useful, not only for the general audience but also as a helpful reminder for those interested in economics.
How is Productivity Measured?
The first thing we need to examine is what actually is productivity and how we can measure it. Therefore, we need to understand how we define and measure productivity in economics. Specifically, we define productivity—or more precisely, "labor productivity"—as simply "economic output per unit of labor input":
Of course, simply providing an equation and calling it a day doesn’t achieve much—after all, an economist’s job is to explain the real world. Let’s start with an example to illustrate: imagine two farmers, Cenk and Feyza, and we want to measure their productivity. Feyza works for one hour and harvests 1 ton of crops. In the same amount of time, Cenk harvests 5 tons of corn. Using the equation above, we find that Cenk is five times more productive than Feyza:
When dealing with a single good, measurement is straightforward. But what do we do when there are multiple goods? In such cases, we can’t measure productivity the same way as above because, for instance, the productivity required for corn may differ from that for apples. What we would do instead is aggregate these goods using a common unit of measurement—prices. This makes the calculation simpler.
What can we use to represent economic output collectively? Prices. (As a quick side note, it’s worth reiterating that prices are probably one of the most important signaling mechanisms in the world—perhaps the finest example of spontaneous order. Hayek’s The Use of Knowledge in Society8 might very well be the one must-read in economics.) Prices aren’t merely numbers; they reflect value and subjectivity as perceived by individuals—one of the cornerstone insights of our discipline since the Marginal Revolution. This is a thing that deserves its own post, but to stay on track, let’s move forward.
When we talk about "output," we mean the sum of each good's quantity multiplied by its price:
If Feyza sells 5 tons of corn at 100 Turkish Liras per ton, her "output" would be calculated as:
Similarly, if Cenk sells 5 tons of potatoes at 50 TL per ton, his "output" would be calculated as:
Is this approach good enough? Perhaps, but we encounter two issues: first, what we call productivity becomes equal to the average hourly income. Even worse, because prices are not a stable variable, what we measure as "productivity" stops being a reflection of actual "productivity." Let’s examine these issues one by one:9
What we did above essentially measures what we call gross income—that is, sales. By multiplying the quantity of each good sold by its price, we can calculate the income earned by an individual:
To calculate "productivity" here, we divide income by the total hours worked:
Thus, the productivity measure here is essentially an income measure. Any relationship between "productivity" and wages is inherently tautological, as wages follow productivity. Beyond equating productivity to average hourly income, using prices to measure "output" can also make productivity ambiguous.
Let’s assume the prices of the goods sold by our farmers suddenly double. In this case, their nominal incomes also double. Real income, of course, is another matter—after all, we’ve known for a long time that a one-time 100% increase in the money supply, like a "helicopter drop," doesn’t lead to real changes.10 But if what we define as "output" equals nominal income, can we then say that "output" has doubled as well? No, because the increase comes from nominal price changes, not from real output. To find the real change in output, you must hold prices constant.
At first, this approach might seem reasonable, but I think it also introduces some confusion when calculating real variables. For instance, imagine a scenario where Feyza produces 1 ton of corn and 5 tons of potatoes, while Cenk produces 5 tons of corn and 1 ton of potatoes. If we were to ask students in an introductory economics class which of the two has a higher output, most would likely say that it’s unclear.11
Now, let’s assume that corn is sold at 100 TL per ton and potatoes at 50 TL per ton:
Now, let’s assume that corn is sold at 20 TL per ton, and potatoes are sold at 100 TL per ton:
What’s happening here could lead us into a logical fallacy that we can describe as reasoning from price changes. Scott Sumner warns extensively about this issue,12 and a similar viral graph suffers from the same problem:13

The Wage-Productivity Relationship: Is There Such a Gap?
After discussing a fundamental issue with measurements, we can now return to the wage-productivity relationship. The EPI report uses methods that are standard in economics. First, I’ll explain why the graph is problematic even within our standard measurement methodology, independent of the measurement problem I mentioned earlier. Then, I’ll discuss the nature of these measurements and question whether all of this is even significant. The conclusion lies in the combination of these perspectives.
One of the primary reasons why the EPI report and similar studies show a gap between wages and productivity is that they compare different groups of workers and ignore part of workers’ compensation. For instance, if we examine the viral EPI graph, productivity is measured for all workers (including the self-employed), while wages consider only the earnings of some workers. The report uses the Bureau of Labor Statistics (BLS) payroll survey, which includes only "production and non-supervisory employees" in the private sector. According to BLS data, these groups make up about 63% of all workers in the U.S. economy. This is precisely one of the problems. If you measure productivity for the entire workforce but consider wages for slightly more than half, the results will not be reliable.
Excluding Performance-Based Pay
The EPI graph also excludes performance-based compensation. The BLS payroll survey completely omits worker earnings from commissions, bonuses, and stock options.14 However, this exclusion is particularly problematic in this context, as performance-based pay has become increasingly common in the American economy since the 1970s.15 For instance, many senior corporate employees receive a significant portion of their total compensation in the form of stock options. If the company they work for performs well, their stock options gain value, and vice versa. Ignoring performance-based pay when analyzing the wages and productivity of different worker groups significantly distorts the entire comparison.
Another issue is that the payroll survey provides insufficient data for measuring the wages of production and non-supervisory employees. Researchers from the BLS have noted that the payroll survey shows much slower wage growth for these workers compared to the household survey conducted by the BLS.16 The reason is that most companies do not classify their employees as "production and non-supervisory employees." So when the BLS conducts this survey, a large portion of the employees whose wages should be reported are excluded.17 According to researched who have examined this, "the segment of workers whose earnings are traditionally reported in the CES does not represent the average earnings of the nonfarm business sector."18
In any case, there is no reason to expect that a flawed measure of wages for hourly workers should rise at the same rate as the productivity of all workers in the economy. Such a measure, on its own, would be illogical. Just as Cenk and Feyza’s productivity or wages in the same field do not have to match, the same applies to different professions and worker groups. Using the total worker compensation data from the National Income and Product Accounts (NIPA) changes many things. NIPA includes all workers and performance-based pay in its calculations. This alone increases wage growth from 10% to 47% between 1973 and 2014.19
The Self-Employment
There is another significant problem. These surveys include self-employed individuals in productivity measurements but exclude them from wage data. This is a critical issue because many Americans work in self-employment or operate single-person businesses. One of the challenges in calculating this is that these incomes can take many forms, blurring the lines between income and business profits. Some individuals may own single-person businesses—think of the grocer in your neighborhood or a small café owner. Others may work in solo professions, such as a plumber or a contractor. We can even imagine a truck driver who might fall into either category. None of these individuals are included in the wage data.
Additionally, a growing number of people now earn income through the Internet. This "new economy" is excluded from these datasets because it is classified as self-employment. For example, an Uber driver, someone earning rental income through Airbnb, or an individual selling goods on Etsy or similar platforms (in Turkey, think of Dolap or Trendyol) is included in productivity measurements but excluded from wage data. The payroll survey excludes these workers entirely. Furthermore, self-employed individuals report their earnings to the IRS differently than companies report to their employees. As a result, both the BLS payroll survey and NIPA worker compensation figures omit self-employment income.
If we are to conduct a proper analysis, we must include self-employed individuals in both productivity and wage measurements. Including them in only one of these measures naturally creates a discrepancy. Alternatively, it might be reasonable to exclude them from both productivity and wage measurements, as self-employed individuals effectively pay themselves per unit of output. Including them does not methodologically address the question of whether firms pay employees based on their productivity. If we do this, productivity growth from 1973 to 2014 falls from 91% to 81%.20 When combined with the adjustments made in the previous section, wage growth reaches 47%, closing more than half of the gap shown in the EPI graph.
How Do We Measure Inflation?
The remaining gap is almost entirely related to a simple mathematical error: the reports and graphs showing this gap measure wages and productivity using different inflation indices. As I mentioned at the beginning, to observe real growth, we must exclude changes in prices—that is, inflation—for both wages and productivity. We use inflation indices to adjust our data for inflation. In such reports, wage inflation is measured using the Consumer Price Index Research Series (CPI), while inflation for labor productivity is measured using the Implicit Price Deflator (IPD). These two inflation measures are not directly comparable; comparing two completely different indices is more absurd than comparing apples and oranges. These indices use different methodologies, rely on different datasets, and account for different goods and services. As this topic is now more technical, it’s worth discussing basic statistics and how indices are constructed.
The Bureau of Labor Statistics (BLS) calculates the Consumer Price Index (CPI) to measure the inflation consumers experience in daily living. The CPI uses the Laspeyres methodology, meaning the index is based on a fixed basket of goods and services that the average consumer purchased during a base year. The CPI then measures how the prices of these goods change over time. As covered in basic statistics courses, the issue with Laspeyres methodology is that it does not account for changes in consumer behavior, such as substitution bias, when prices change. For example, if PlayStation consoles become cheaper, consumers may start buying more of them, but the Laspeyres methodology, and thus the CPI, does not account for this. The formula for the Laspeyres methodology is as follows:
Here, Pt represents the price of a good in period t, Pt-1 represents the price in the base period (i.e., t-1), and Qt-1 represents the quantity in the base period.
First, we calculate total expenditures by multiplying the base period prices with the base period quantities. Then, we calculate current period expenditures by multiplying current prices with the base period quantities. The ratio of these two totals provides the percentage change in prices from the base period to the current period. The primary goal of this approach is to measure price changes while ignoring changes in quantities. However, the substitution bias issue we mentioned earlier makes the CPI a less-than-ideal choice for this purpose.
Because of this problem, the NBER uses the Fisher chain formula to calculate the Personal Consumption Expenditures (PCE) price index and the Implicit Price Deflator (IPD) for nonfarm businesses. As covered in basic statistics courses, the Fisher chain formula essentially calculates the geometric mean of the Paasche and Laspeyres indices. Paasche is the exact opposite of Laspeyres: while the Laspeyres index fixes a basket of goods from a base year, the Paasche index fixes the basket of goods in the current year and compares current prices with those of previous years. By taking the geometric mean of the two, the Fisher index accounts for changes in consumer spending patterns across years, providing a more accurate picture of changes in purchasing power.
The formula for the Paasche index is as follows:
Here, Pt corresponds to current period prices, Qt to current period quantities, and Pt-1 to base period prices.
The Paasche index allows us to understand how prices have changed by focusing on the quantities in the current consumption basket. Since this index reflects current consumption patterns, it is particularly useful for analyzing the impact of price changes on consumers.
The Fisher index, on the other hand, is expressed as follows:
The first part here represents the Laspeyres price index, while the second part represents the Paasche price index.
The main advantage of the Fisher index is that it takes into account the quantities from both the base period and the current period. This allows us to better capture the effects of price changes on consumption patterns as well as broader economic trends.21
Errors Caused by Using Different Indices
An artificial gap appears between wages and productivity when different price indices are used. Comparing CPI with IPD from 1973 to 2024 reveals a difference of over 20%. Such a gap between wages and productivity does not exist in reality; it is entirely the result of a mathematical calculation difference, i.e., comparison of different methodologies. If we are to compare two datasets, the same methodology must be used for both.
What causes this discrepancy? There are three main issues: the CPI does not regularly account for changing consumption habits, it uses different data, and it measures different goods and services.
For a long time, we’ve known that the behavior of market participants determines prices and output. For example, as individuals demand more PlayStations and they become more accessible, prices drop, which, to some extent, leads to increased demand. The point where the supply curve and demand curve meet is called equilibrium. Conversely, the prices of goods or services with less demand may rise as individuals use them less, or broader shifts in preferences may change the goods and services consumed. For instance, widespread boycotts could alter the consumption basket, even for a portion of the population. However, the CPI rarely accounts for this substitution effect. As a result, most economists argue that the CPI overestimates inflation. On the other hand, the IPD uses the Fisher index, which regularly accounts for changes in spending patterns.
The IPD also uses more accurate data than the CPI. To calculate the CPI, the BLS relies on data from the Consumer Expenditure Survey (CEX), which estimates how much consumers spend on various goods and services. However, this survey has significant issues: many studies have shown that households remember large and recurring purchases more accurately. For example, the CEX measures how much Americans spend on rent and utilities with reasonable accuracy. However, households often forget smaller and less regular purchases during interviews, resulting in underreporting. This underreporting can make it appear that Americans spend far more of their income on housing or utilities than they actually do.22 Consequently, the CPI tends to overestimate inflation to some extent. The IPD, in contrast, is calculated using business sales data.23 Since these records are documented, the IPD does not face the same problem, which is one reason why it is typically lower than the CPI. These technical differences do not account for the entire gap, but they make the CPI less reliable than the IPD. For example, if the CPI were used for productivity, it would show slower productivity growth.
These differences explain the remaining gap between productivity and wages. Both the Federal Reserve24 and the Congressional Budget Office25 target this alternative index—the Personal Consumption Expenditures (PCE) index—a more accurate measure of consumer inflation than the CPI. A common misconception is that the Fed uses the CPI for its 2% inflation target, but it actually uses the PCE. By using the PCE, we account for changing consumption patterns and use more accurate data on consumer expenditures. When we measure wages using the PCE—the index used by both the Federal Reserve and the government—average wage growth increases from 47% to 62%.26
Finally, it’s worth noting that indices like the IPD, PCE, and CPI all measure different goods and services. The CPI and PCE track the prices of goods and services that Americans consume, whereas the IPD measures changes in the prices of goods and services that Americans produce. Naturally, these datasets will differ, as individuals in an economy can export their goods and services or consume products produced in other countries. However, it is important to point out that, since 1973, the PCE has grown at nearly the same rate as the IPD for net domestic product. Thus, when using the same methodology, there is no significant difference in price growth for the production and consumption of goods and services across the overall economy.
However, we can observe differences between the PCE and IPD within the nonfarm business sector, which the PCE covers. For instance, prices for sectors like nonprofit organizations, public services, or owner-occupied housing have risen faster than the rest of the economy. Since the IPD excludes these sectors, it grows more slowly than broader price indices for consumption or production.
Employing the Same Methodology
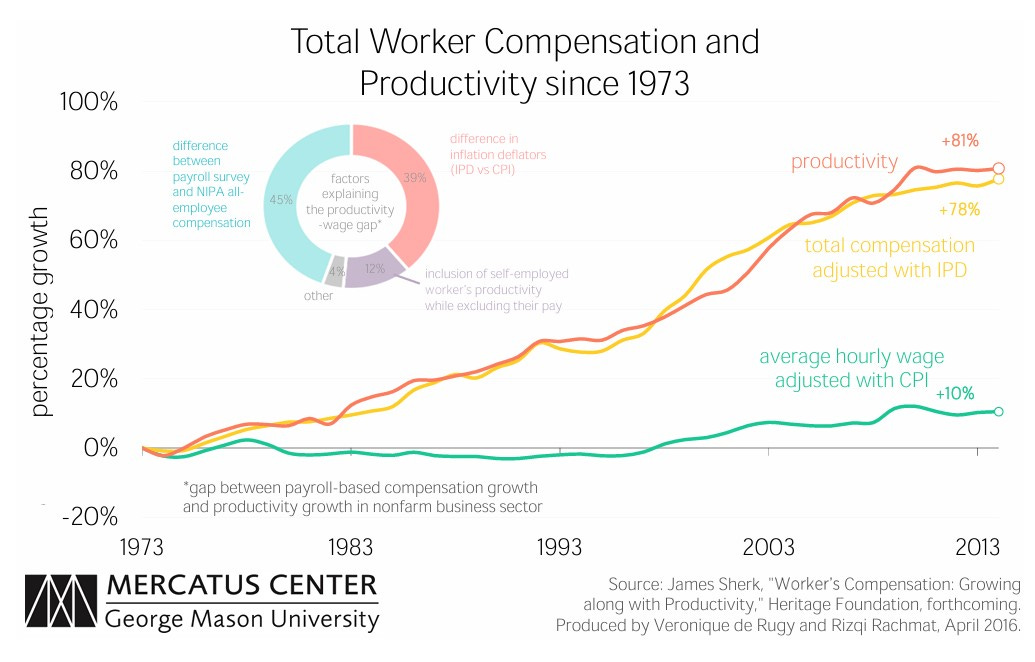
When we calculate both wages and productivity using the IPD, average wage growth rises from 62% to 78%, while productivity, as mentioned earlier, is 81%. The gap from the original viral graph almost entirely disappears.27
We must also discuss whether it makes sense to measure inflation using the IPD. For instance, if we are concerned with how living standards have improved, wages should be measured using a consumer price index. For this purpose, the PCE is more appropriate than the CPI, for the reasons outlined earlier. However, if we are examining whether wages have risen in line with productivity, both should be measured using the same production price index.28 As I mentioned initially since the comparison between productivity and wages is inherently tautological, theory dictates that they should already align: wages paid by companies to employees originate from the revenue generated by the goods or services they produce.
Ultimately, using one price index to measure wages and another to measure productivity introduces statistical issues that do not exist in the real world. Over the past decade, numerous studies on this topic have highlighted the importance of including total worker compensation, not just cash wages.29
In conclusion, the difference between payroll survey-based wage measurements and the NIPA data covering all workers accounts for 45% of the gap in the EPI graph. Including self-employed individuals in productivity but not in wages explains 13%. Using different methods to measure inflation accounts for 39%. When wages and productivity are measured using the same methodology, the results are as follows:
A 2016 study by the Mercatus Center measures both productivity and wages using the IPD:30
Ultimately this graph at most tells us that some workers earn much more than others. This entire story is not about capital versus labor but about high-wage labor versus low-wage labor. (The state of wage inequality and the misconceptions surrounding it deserve a separate post, which I plan to write about in the future.)
The lesson we should take away is that interpreting a graph largely depends on theory and methodology. To understand which theory and methodology should be used for a graph, we need to examine it closely.
When Ideological Motivations Distort Perspectives
The result we arrived at above should have been clear from the beginning, as discrepancies do not occur in tautologies by their nature. However, it was still important to demonstrate that there is no such gap even when using standard measurement units. But I believe the more pressing question is different—one that is much more closely related to how we measure productivity.
The EPI report states that net productivity is measured as "the growth in goods and services output minus depreciation per hour worked." To the general reader, this might sound like we are measuring the physical quantity of output, but that’s not the case. What we call the output of goods and services refers to the value of goods and services as measured by Gross Domestic Product (GDP). "Depreciation," on the other hand, refers to the loss of financial value of capital over time.
Thus, "Net Domestic Product" is calculated as follows:
One of the issues with these calculations is that they adhere to the principles of double-entry accounting. For this reason, whether you calculate GDP from the perspective of consumption, income, or production, you arrive at the same result. For example, when a house is built and sold, this is recorded as a sale—or more precisely, as "output." On the other side, the same sale is recorded as "income." In GDP calculations, production/output equals income.
Net Domestic Product, on the other hand, represents only the sales side of the ledger and is equivalent to Net National Income, which refers to the total income of all individuals in a country.
To calculate the productivity of workers, Net Domestic Product is divided by the total number of labor hours worked:
However, this is essentially the same as dividing National Income by the total hours worked. When we divide National Income by total hours worked, what we are actually measuring is average hourly income. Thus, what we call Productivity and average hourly income should be the same—they are, by nature, tautological. But this raises a fundamental question: why do we measure Productivity this way, or how should we measure Productivity? The answer depends somewhat on how we conceptualize economics.31
This definition of Productivity can be used by both mainstream and heterodox economists. For example, Marxist economists use this definition to argue that income distribution is unjust. Similarly, other, more mainstream economists use it to argue the opposite. However, this strikes me as an issue of flawed thinking from the outset. Using terms this way gives ideological leverage to those making such arguments. Instead of saying that workers’ relative wages have declined, they claim that workers are not being paid as much as they produce. Marx understood the importance of propaganda very well, and the latter claim—that workers are not paid as much as they produce—is a much better propaganda tool, even if it does not reflect reality. Another issue arises in such analyses: as argued by Marxist economists or left-leaning social scientists, the claim that there is an American working class is misleading. This is because the American workforce is fundamentally different from the classical working class.32

Moreover, the issue with this kind of ideological bias is that it can work in both directions. For instance, the EPI report uses income to measure "productivity" at the national level, but what happens if we apply this approach at the sectoral or individual level? Strangely enough, the EPI report explicitly warns against this, as it leads to the opposite conclusion—a result you wouldn’t want if your motivations are ideological.
In fact, the more narrowly and micro-level we equate income with productivity, the more we will find that everyone "earns what they produce." This is because, as we examine smaller and smaller groups, we eliminate the possibility of sampling subgroups whose income deviates from the group’s average. The issue with the report here is that it makes an ideologically motivated claim while only accepting it when the results align with its narrative. When the results fit, equating productivity with income is not an issue. However, as the analysis becomes more detailed and micro-level—effectively erasing the gap—this becomes problematic. Unfortunately, the EPI report commits the same error many heterodox economists make. They first reject the assumption that individual income equals productivity but later equate income and productivity at the national level because it produces the desired result.
This double standard cannot be justified under any circumstances. Either we accept neoclassical theory and equate income and productivity across the board, or we reject neoclassical theory and deny all such equivalences. Many heterodox economists do not opt for the latter, but the reason is clear: rejecting income and productivity equivalence invalidates any measure they could use to support their claims.
The Real Problem Is Nominal… Again.
What have we learned so far? Actually nothing new or wasn’t covered by economists before. But let’s say we re-learned that when analyzing a graph, the methodology and data used to create it are crucial, the underlying theoretical model must be understood, and in the case of the wage-productivity relationship, we are essentially comparing two nearly identical halves of the same whole.
Additionally, we must avoid falling into the logical fallacy of "reasoning from a price change" in economic reasoning. This is a mistake frequently made by both economists and non-economists. As Scott Sumner illustrates with his example:33
For thirty years I taught introductory economics to both undergrads and MBA students. After covering supply and demand, I liked to pose the following question, to see how much they had learned:
Suppose you are interested in testing the theory of supply and demand. You go out to observe the number of people who attend movies when the price is $6, and also when the price is $10. You find that, on average, there are 40 patrons in the movie theater when the price is $6 and 120 patrons when the price is $10. Is this result consistent with the laws of supply and demand? Explain.
More often than not, after I posed this question, there was complete silence. Occasionally one student would know the answer. The correct answer is that this finding is completely consistent with the laws of supply and demand, as would be any other pair of equilibrium points. But most students don’t see this. Why not?
To make it easier to see, I point out that the $6 price might occur in the afternoon, when demand is low, and the $10 price in the evening, when demand is high. Some students will object that I haven’t “held other things equal.” But that’s a nonsensical response, because we are comparing two different equilibrium points, and if P and Q have changed, then obviously other things could not possible have been equal. Any change in price and quantity requires a shift in supply or a shift in demand, or both.
Here is the real problem. When looking at these two data points, students subconsciously try to align them along a single demand curve. That is, it looked as if the field study of movie theaters had discovered an upward-sloping demand curve. In fact, the two points lie along a given supply curve, and it’s the demand curve that has shifted. Not only is my example not some sort of weird puzzle or paradox; it is as straightforward an application of the theory of supply and demand as you can imagine.
Even most high school students know that if a storm wipes out 90% of the orange crop in Florida, then the price of oranges will rise. That’s an example where the supply curve shifts, and equilibrium moves along a given demand curve. Students who are confused by the movie-theater question are probably implicitly assuming that price changes are caused by supply shifts, and that we should move along a given demand curve. If the price is higher (they incorrectly reason), we can expect consumers to buy less. But that’s not at all the prediction of the supply-and-demand model! Whether consumers end up buying more or less depends entirely on whether the price change was caused by a shift in supply or a shift in demand.
The bottom line is that one should never say, “The price of X is rising (or falling) and therefore we can expect the equilibrium quantity of X to fall (or rise).” I call this misuse of the basic supply-and-demand model “reasoning from a price change,” and that phrase seemed to catch on with some bloggers and journalists after 2009. I’ve used this phrase as the title of Part 3 of the book because this misuse of supply and demand theory underlies many of the problems with modern macroeconomics.
From my perspective, I find the neoclassical theory on the calculation of productivity to be accurate. However, at the heart of this entire discussion, I believe there is an error similar to reasoning from a price change when comparing productivity and wages. After demonstrating above that there is no gap between productivity and wages, the largest remaining category is wage inequality. But, of course, you cannot include this in a wage-productivity graph because it has nothing to do with productivity or wages; it is purely about wage inequality among workers.
Since wage disparities among workers are a completely separate topic, and this piece is already lengthy, I will address it in the next article. However, beyond wage disparities, we must also discuss the general trend of wage growth. We know that wage growth and productivity are almost equal, and we are also aware that productivity drives wage growth. Therefore, we must understand the importance of consistently increasing both over time.
But it’s not just for this reason. Nominal hourly wages are, in fact, fundamental to the economy and should be one of the most critical variables we focus on. Although I’ve addressed these topics in previous articles, I find it important to reiterate them here.
Sticky Wages: The Key Problem of Macro

The reason we worry about recessions is mostly involuntary unemployment. Because recessions cause employment fluctuations, and this affects the entire economy. But, why do recessions cause employment fluctuations? Indeed, this question is one of the most important questions at the heart of macroeconomics, and it shows us why nominal variables and wage s…
IS-LM is not a useful model

The IS-LM model depicts the relationship between interest rates and the asset market. It is a tool for analyzing how the markets for economic goods intersect with the loanable funds market. In the model, "M" is the quantity of money, whereas "L" is the liquidity preference(that is, how much the investors prefer to hold less liquid assets rather than mon…
For example, the reason we worry about a recession is often unemployment. Recessions or depressions cause employment fluctuations, which, in turn, impact the entire economy. But why is that? This question lies at the heart of macroeconomics and highlights why nominal variables and wage stickiness are so critical during recessions. My central argument is this: if we want wages, productivity, and everything else we care about in the economy to remain stable, we need to ensure that the fundamental variable influencing them grows at a stable rate—nominal variables:34
A useful way to distinguish shocks that affect the economy is to classify them as nominal and real shocks. Real shocks include the natural employment rate, technology shocks, taxes, and similar types of variables. Real shocks are particularly important when prices and wages are relatively flexible. If we lived in a world where all wages are perfectly flexible, nominal variables would be almost unimportant in this sense, and real variables would be enough to explain business cycles. Alas, that's not the case, and it's exactly what makes sticky wages the key problem.
Keeping nominal variables stable largely depends on maintaining stable Nominal GDP (NGDP) growth. Thus, if we want employment and wage growth to remain stable, NGDP is the variable we need to focus on.
Why is NGDP important? Because it represents the total value of income in the economy measured in monetary terms. Most contracts in economies are signed under nominal terms. For this reason, NGDP is a useful metric for evaluating people’s ability to fulfill nominal contractual obligations. NGDP is more than just the sum of RGDP and inflation—it has tangible, real-world effects. As I’ve argued before, NGDP is a crucial indicator of everything we care about in an economy:35
because hourly wages closely follow NGDP/person, and we live in a world where wages are sticky; hours worked fall when nominal spending falls. In other words, when an economy is hit by a negative nominal shock, W/NGDP becomes highly counter-cyclical because nominal wages are sticky. That is why it is especially useful in explaining employment fluctuations, hence the recessions.
For all of this, I also believe that using the "Musical Chairs" model36 offers significant advantages:37
In the model, the AD curve is merely a rectangular hyperbola (simply NGDP, or nominal expenditures). AS is merely a function that represents short-run output. And finally, "OL" is a vertical curve that shows the long-run output, i.e., the optimal level of the economy. Since nominal wage stickiness is the underlying assumption of this model, the “Optimal level” will vary depending on the type of wage stickiness and will require us to define nominal shocks in terms of wage stickiness.
Let's go back to what we were concerned with in the first place, unemployment. The AS/AD model was developed to explain fluctuations in employment. So the first thing we'll look at is the labor market. And everything becomes clearer when we look at it. Hours worked move in the same direction as NGDP.
The simple implication of the model is that NGDP shocks affect both production and inflation. I think this model, the "musical chairs", is much more useful in explaining movements of nominal variables or sticky wages, hence, business cycles.
If we care about wage growth, employment, and similar variables, we should focus on what kind of monetary policy regime can stabilize them. For example, in the past, George Selgin proposed a monetary policy rule called the "Productivity Norm" in his book Less Than Zero. The core idea was that the price level should move inversely to productivity shocks, keeping the flow of spending per capita relatively stable.38
Similarly, the advantage of using NGDP as a benchmark for assessing the economy implies that targeting inflation and interest rates should be abandoned. One framework I’ve long written about and supported is NGDP Level Targeting.39 However, frameworks such as Gross Labor Income (GLI) targeting are also possible and could stabilize employment fluctuations.40
The key takeaway from all of this, I believe, is to identify the fundamental factors driving the variables we care about in the economy and human life—controlling the underlying causes rather than the symptoms. Ultimately, this brings us back to nominal variables and NGDP.
If we want wages to grow steadily, we should focus on the "real issue" of nominal variables rather than gaps that do not exist in the real world.
Bivens, Josh, and Lawrence Mishel. "Understanding the Historic Divergence Between Productivity and a Typical Workers' Pay." Economic Policy Institute Briefing Paper, no. 406 (2015). http://www.epi.org/publication/understanding-the-historic-divergence-between-productivity-and-a-typical-workers-pay-why-it-matters-and-why-its-real/ (accessed November 22, 2024).
Feldstein, Martin. "Did Wages Reflect Growth in Productivity?" Journal of Policy Modeling 30, no. 4 (2008): 591–594.
Anderson, Richard G. "How Well Do Wages Follow Productivity Growth?" Federal Reserve Bank of St. Louis Economic Synopses, no. 7 (2007). http://research.stlouisfed.org/publications/es/07/ES0707.pdf (accessed November 22, 2024).
Baker, Dean. "Behind the Gap Between Productivity and Wage Growth." Center for Economic and Policy Research Issue Brief (2007). http://www.cepr.net/documents/publications/0702_productivity.pdf (accessed November 22, 2024).
Lawrence, Robert. "The Growing Gap Between Real Wages and Labor Productivity." Peterson Institute for International Economics Real Time Economic Issues Watch, May 21, 2015.
Rose, Stephen. "Does Productivity Growth Still Benefit Working Americans? Unraveling the Income Growth Mystery to Determine How Much Median Incomes Trail Productivity Growth." Information Technology and Innovation Foundation (2007). http://www.itif.org/files/DoesProductivityGrowthStillBenefitWorkingAmericans.pdf (accessed November 22, 2024).
Winship, Scott. "Understanding Trends in Worker Pay Over the Past 50 Years." American Enterprise Institute (2024). https://www.aei.org/research-products/report/understanding-trends-in-worker-pay-over-the-past-50-years/ (accessed November 22, 2024).
Hayek, Friedrich. "The Use of Knowledge in Society." The American Economic Review 35, no. 4 (1945): 519–530. https://www.jstor.org/stable/1809376 (accessed November 22, 2024).
Fix, Blair. "Debunking the ‘Productivity-Pay Gap’." Economics from the Top Down, January 17, 2020. Accessed November 22, 2024. https://economicsfromthetopdown.com/2020/01/17/debunking-the-productivity-pay-gap/.
Sumner, Scott. The Money Illusion: Market Monetarism, the Great Recession, and the Future of Monetary Policy. Chicago: University of Chicago Press, 2021.
Fix. "Debunking the ‘Productivity-Pay Gap’."
Sumner. The Money Illusion.
Albrecht, Brian. "Never Preach from a Price Change: What if High Prices Are Good?" Economic Forces (2022). https://www.economicforces.xyz/p/never-preach-from-a-price-change
Bureau of Labor Statistics. "Current Employment Statistics Survey Report Forms." Accessed November 22, 2024. http://www.bls.gov/ces/idcfcesforms.htm.
Lemieux, Thomas, W. Bentley MacLeod, and Daniel Parent. "Performance Pay and Wage Inequality." The Quarterly Journal of Economics 124, no. 1 (2009): 1–49.
Abraham, Katharine, James Spletzer, and Jay Stewart. "Divergent Trends in Alternative Wage Series." In Labor Statistics Measurement Issues, edited by John Haltiwanger, Marilyn Manser, and Robert Topel, 293–325. National Bureau of Economic Research (NBER), 1998.
Champagne, Julien, André Kurmann, and Jay Stewart. "Reconciling the Divergence in Aggregate U.S. Wage Series." Labour Economics 49, no. C (2017): 27–41.
Champagne, Kurmann, and Stewart. "Reconciling the Divergence in Aggregate U.S. Wage Series."
Sherk, James. "Workers' Compensation: Growing Along with Productivity." Heritage Foundation (2016).
Sherk. "Workers' Compensation: Growing Along with Productivity."
Bureau of Economic Analysis. "Concepts and Methods of the U.S. National Income and Product Accounts, Chapter 1–5." Accessed November 22, 2024. https://www.bea.gov/resources/methodologies/nipa-handbook.
Garner, Thesia L., Robert McClelland, and William Passero. "Strengths and Weaknesses of the Consumer Expenditure Survey from a BLS Perspective." Bureau of Labor Statistics (2009). http://www.bls.gov/cex/pce_compare_199207.pdf (accessed November 22, 2024).
McCully, Clinton P., Brian C. Moyer, and Kenneth J. Stewart. "A Reconciliation Between the Consumer Price Index and the Personal Consumption Expenditures Price Index." Bureau of Economic Analysis (2007). http://www.bea.gov/papers/pdf/cpi_pce.pdf (accessed November 22, 2024).
Board of Governors of the Federal Reserve. "What Is Inflation and How Does the Federal Reserve Evaluate Changes in the Rate of Inflation?" Accessed November 22, 2024. http://www.federalreserve.gov/faqs/economy_14419.htm.
Congressional Budget Office. "The Distribution of Household Income in 2021." Accessed November 22, 2024. https://www.cbo.gov/publication/60341.
Sherk. "Workers' Compensation: Growing Along with Productivity."
Sherk. "Workers' Compensation: Growing Along with Productivity."
Feldstein. "Did Wages Reflect Growth in Productivity?"
Whelan, Karl. "A Guide to the Use of Chain Aggregated NIPA Data." Federal Reserve Board, Finance and Economics Discussion Series, no. 2000–35 (2000). http://www.federalreserve.gov/pubs/feds/2000/200035/200035pap.pdf (accessed November 22, 2024).
De Rugy, Veronique. "Contrary to White House Claim, Compensation Has Been in Line with Productivity." Mercatus Center (2016). https://www.mercatus.org/research/data-visualizations/contrary-white-house-claim-compensation-has-been-line-productivity (accessed November 22, 2024).
Fix. "Debunking the ‘Productivity-Pay Gap’."
Smith, Noah. "America Doesn't Really Have a Working Class." Accessed November 22, 2024. https://www.noahpinion.blog/p/america-doesnt-really-have-a-working
Sumner. The Money Illusion.
Gorgen, Ahmet Kursad. "Sticky Wages: The Key Problem of Macro." Accessed November 22, 2024. https://themoneymischief.substack.com/p/sticky-wages-the-key-problem-of-macro.
Gorgen, Ahmet Kursad. "IS-LM is not a useful model." Accessed November 22, 2024. https://themoneymischief.substack.com/p/is-lm-is-not-a-useful-model
Sumner. The Money Illusion.
Gorgen, Ahmet Kursad. Sticky Wages.
Selgin, George. Less Than Zero: The Case for a Falling Price Level in a Growing Economy. Cato Institute, 2018.
Sumner. The Money Illusion.
Amarnath, Skanda. "Floor It! Fixing the Fed’s Framework With Paychecks, Not Prices." Accessed March 6, 2024. https://medium.com/@skanda_97974/floor-it-fixing-the-feds-framework-with-paychecks-not-prices-78171423e9c1.